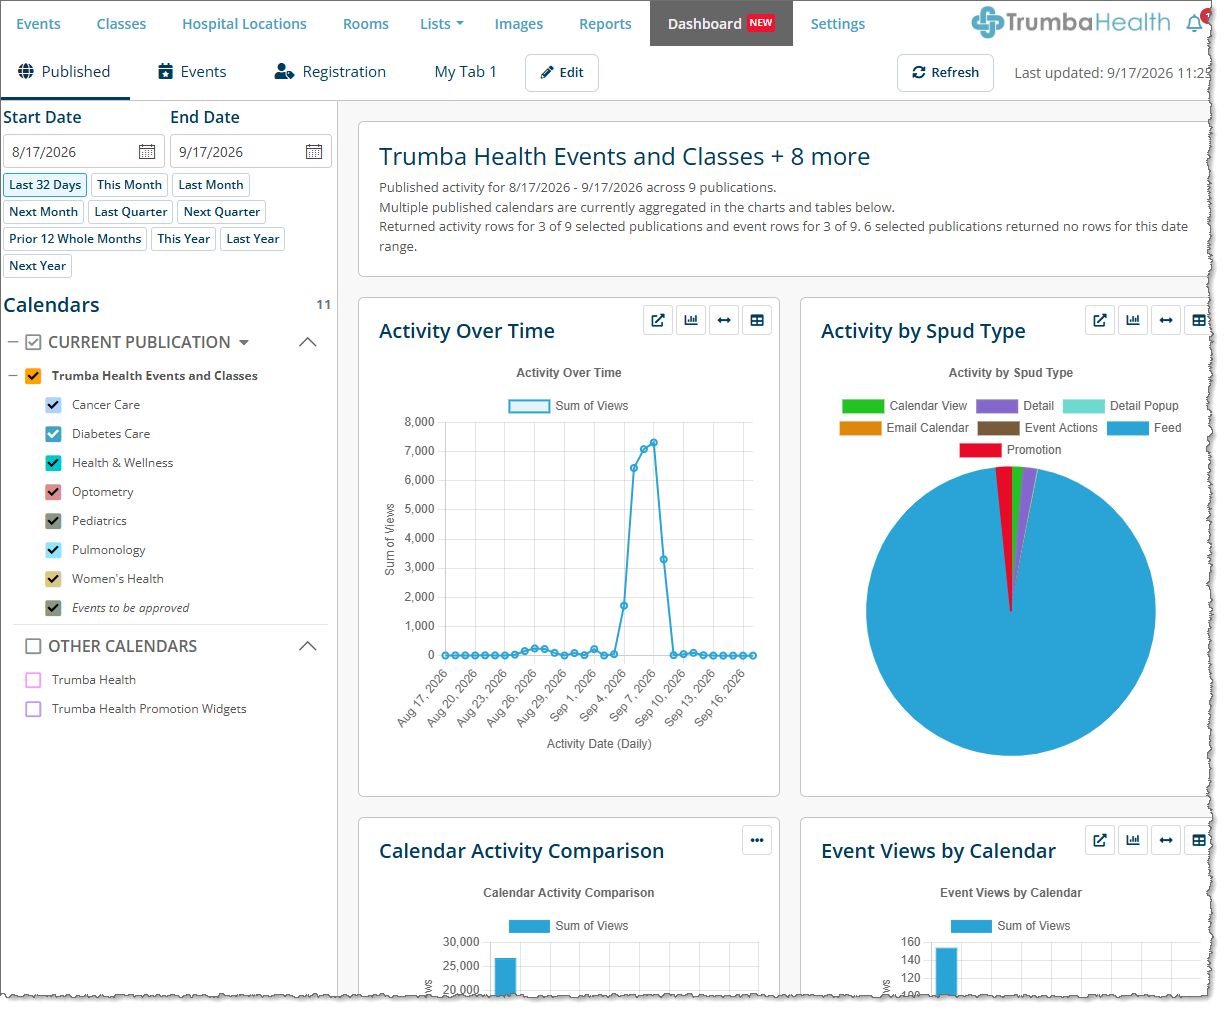
The Dashboard allows you to quickly see data and metrics about user interactions with your calendars and events. With customizable, easy-to-read charts, you can see which events are most popular, which calendar views and spuds users interact with most, and more.
Dashboard functionality is available to Publisher and Customer Administrator account holders.
The Dashboard is divided into predefined and custom tabs that contain calendar, event, registration, and custom usage data in charts and reports. Change the calendars and date range in the Filter pane to dynamically update the chart data.
This topic covers the following topics:
The three standard tabs, Published, Events, and Registration, contain predefined charts and reports. Select the calendars and date range for which you want to display data in the Filter pane.
You can customize the appearance of charts on the Published and Registration tabs, but not their definitions. You can copy charts from these tabs to a custom tab and edit them there.
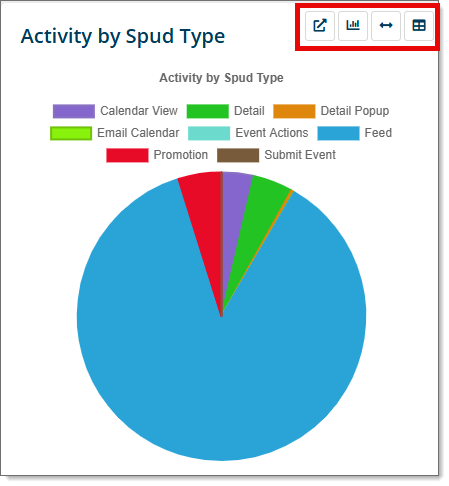
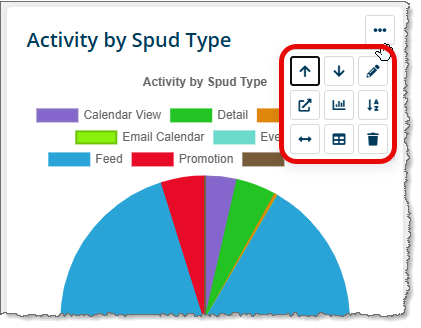
To customize a chart's display on the Published or Registration tab, hover over the options or click the ellipsis button next to the chart title.
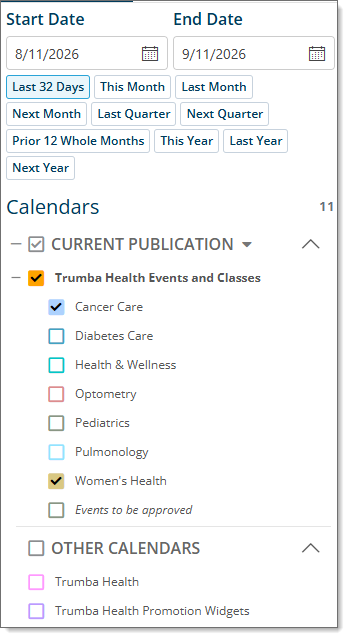
The Filter pane allows you to select the date range and the calendars for which you want to view data.
Note If your screen is narrow, the Filter pane may not be visible. To open it, click the Filter icon
 in the lower left corner of the page to open the Filter pane.
You can specify a Start Date and End Date or select one of the predefined options.
Note The Start Date and End Date refer to the activity date for calendar charts and the event start date for event reports.
Select the check boxes next to one or more calendar names to view their data. The list includes only calendars that you own or that are shared with you.
Note Chart data comes only from published calendars, but calendars mixed into a published calendar are also included in the calendar list.
Note When a custom tab uses the per-widget calendar context, its calendar list does not appear in the Filter pane. See Custom tabs for more information.
The Published tab shows information about interactions with your published calendars.
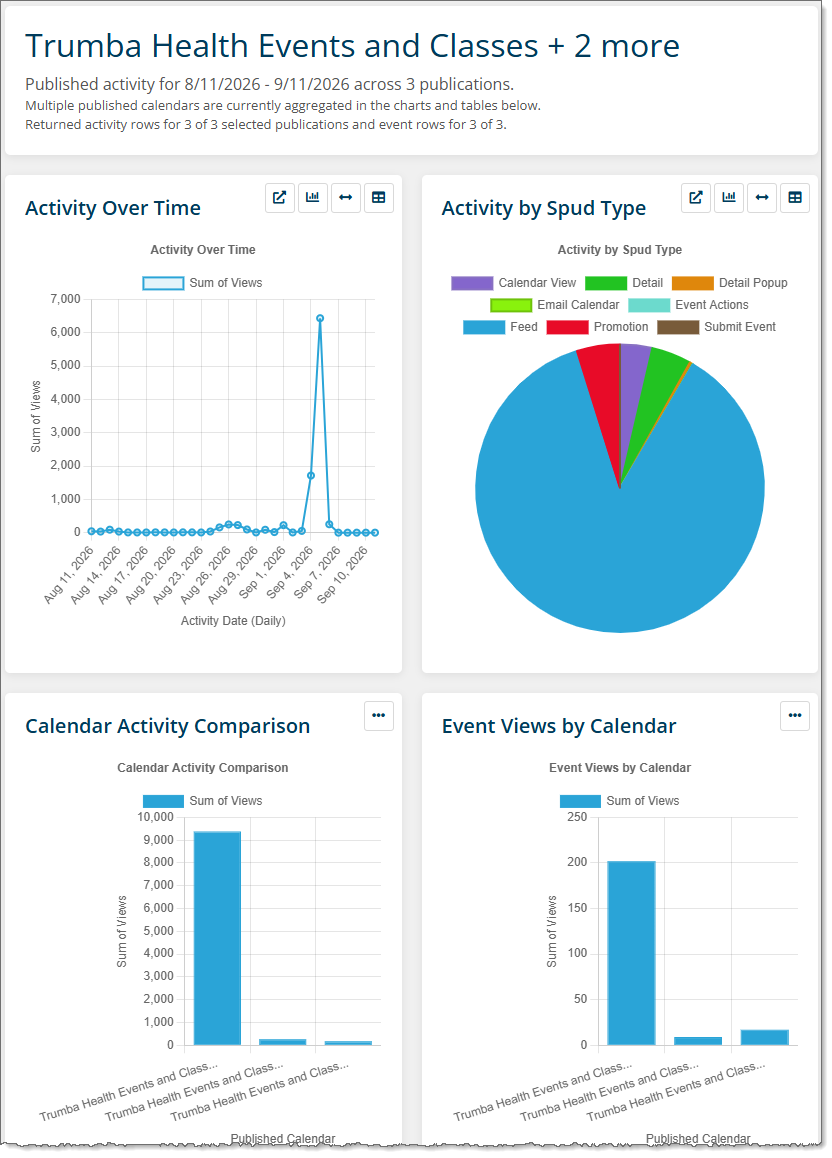
The Published tab contains the following charts and reports:
Change the calendar list and date range in the Filter pane to update chart data. To edit chart definitions, copy charts from this tab to a custom tab. See Custom tabs.
The Events tab shows event activity for events owned by the selected calendars whose start dates are within the date range selected in the Filter pane.
The Events tab contains the following reports:
The Events list shows events owned by the selected calendars with start dates within the selected Start Date and End Date. The upper-right corner of the list shows the number of events.
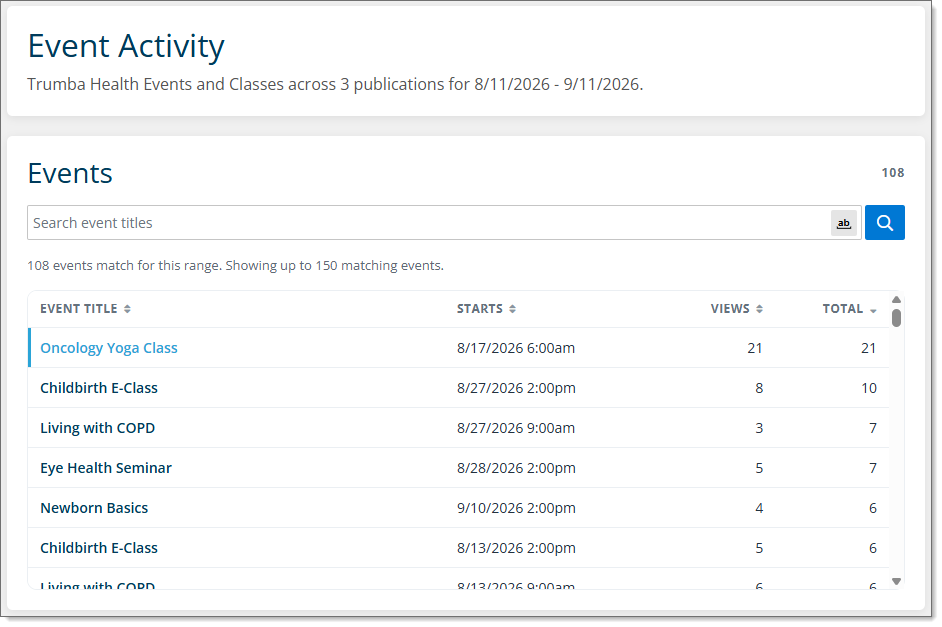
If you have many events, search the list by title. The number of events matching the search criteria appears below the search box.
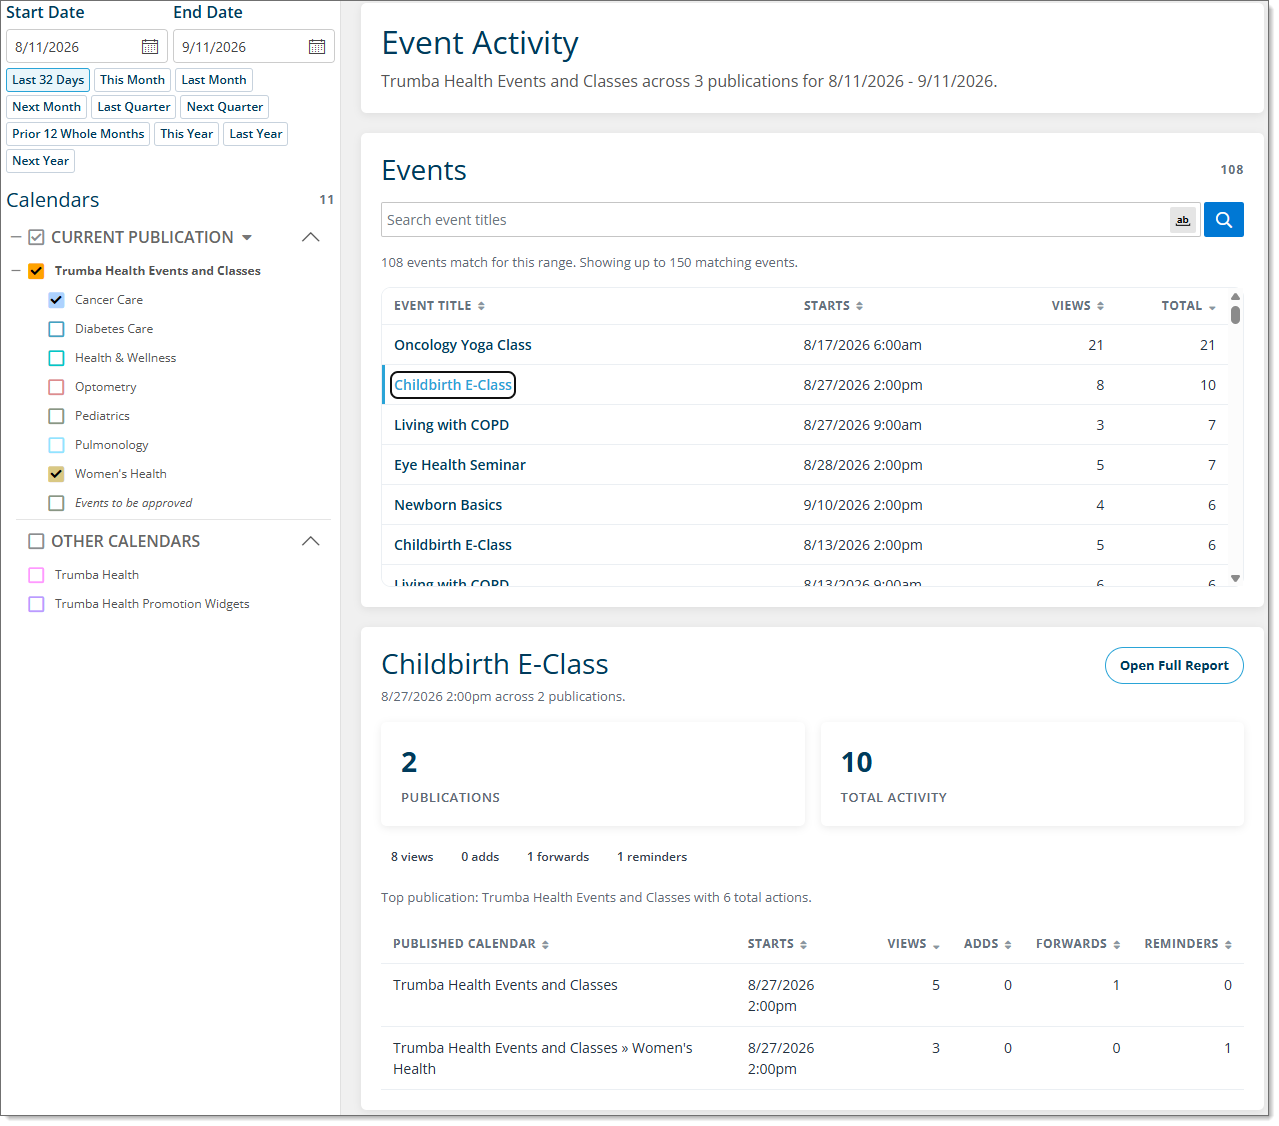
To view an event's details, click its title in the Events list.
After you click an event title, you can view detailed event interactions, including views, adds, forwards, and text or email reminders.
Note Events can appear on multiple calendars. Event details show data only for the calendars selected in the Filter pane.
The Registration tab shows charts related to registration activity.The Registration tab contains the following charts:
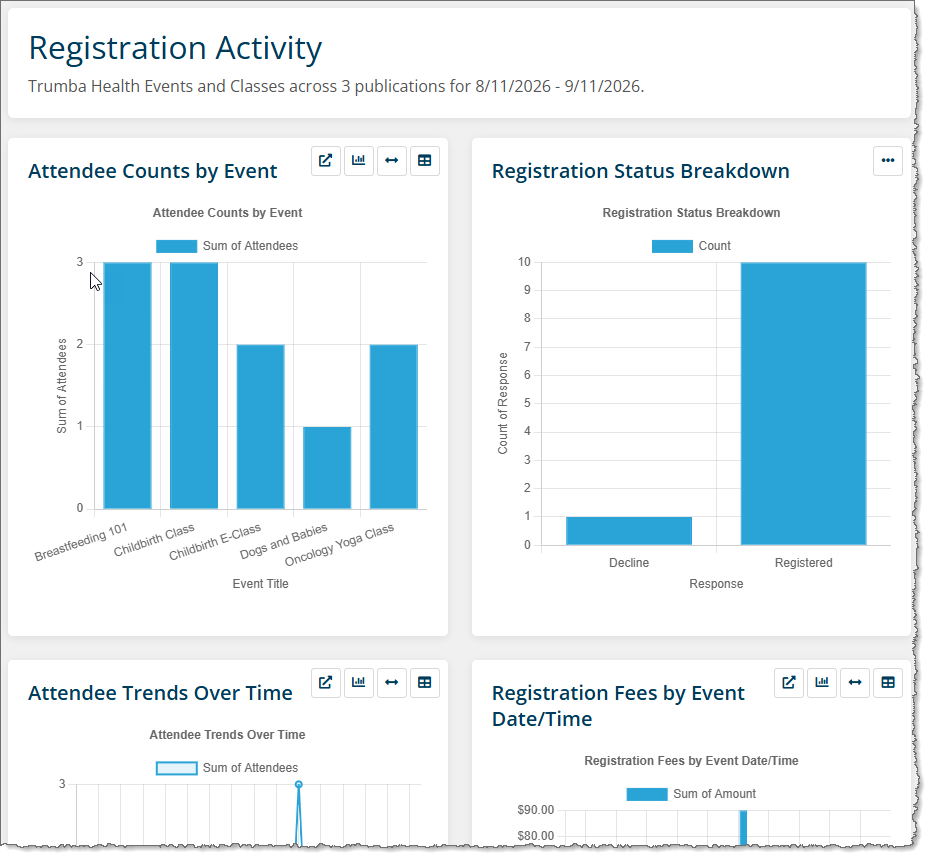
Change the calendar list and date range in the Filter pane to update chart data. To edit chart definitions, copy charts from this tab to a custom tab. See Custom tabs.
Click Edit to edit the Dashboard's tabs and charts. In edit mode, you can change tab placement, create tabs, edit custom tabs, hide tabs,and more.

In the tab title, click the gear icon to open the edit menu. Hover over an option to see its description. You can also click on a tab and drag to reorder the tabs. Click Save when you finish editing.
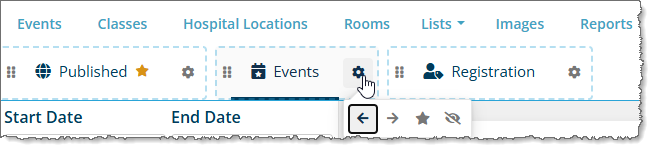
Note See Custom tabs for information about adding tabs.
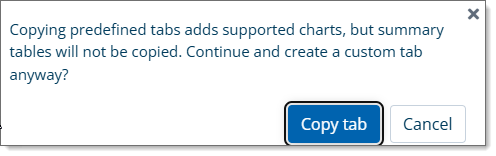
In addition to the predefined tabs, you can add tabs containing custom reports and charts. You can also copy the Published or Registration tab to a new tab and edit its charts.


New custom tabs have several available settings.
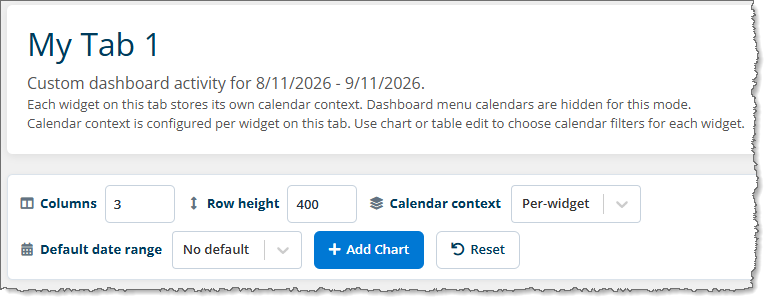
You can:
Note Although the calendars used in a per-widget tab are static, each chart can use a different calendar. A default date range applies to every chart on the tab, but can be changed in the Filter pane.
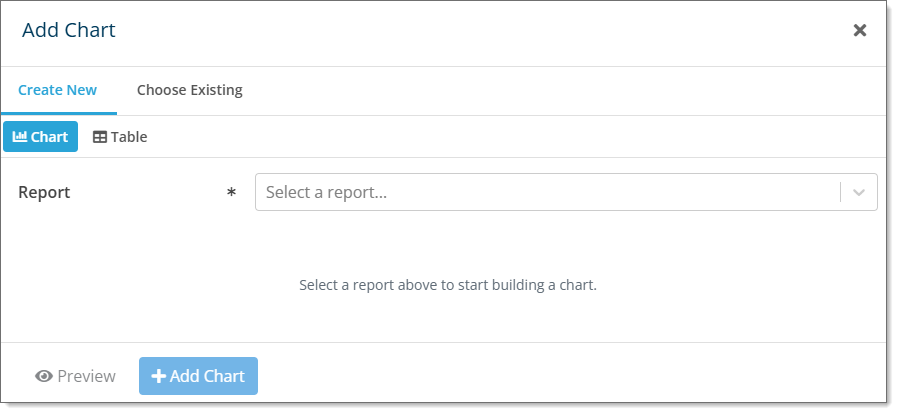
Note Saved custom charts are available in the Choose Existing list. See Reports and Charts for more information.
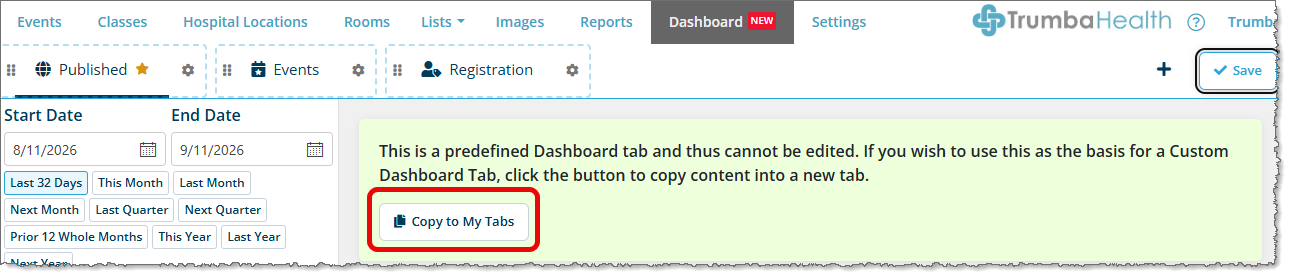

After adding a chart to a custom tab, you can edit it as necessary.
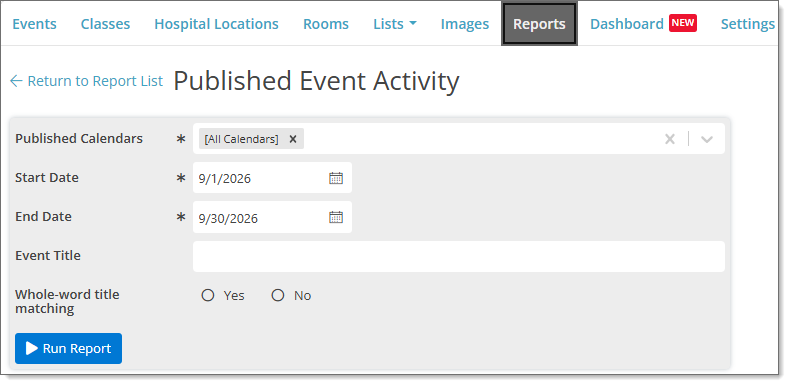
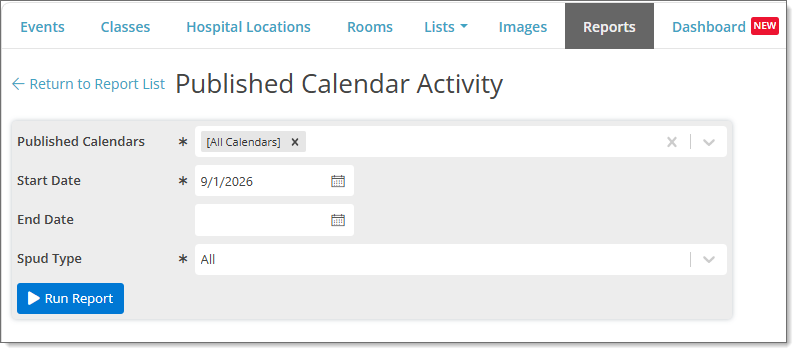
If you want to export spud and event data, as was available on the legacy Publisher Dashboard, you can run the Published Calendar Activity and the Published Event Activity reports. You can select specific calendars and a custom date range for these reports which gives you more flexibility than the legacy Publisher Dashboard.
To run the Published Calendar Activity report:
To run the Published Event Activity report: